


This post is part of a series unpacking The Flashtalking Framework.
Our final phase, Iterate, focuses on learning and optimizing. While we could have named this phase "Report" or "Measure," we chose the word "Iterate" deliberately. It implies not just action but repeated action. There are two critical components to what we refer to as "Iterate:"
- Operational dashboards and reporting: We believe in accessibility and transparency when it comes to reporting, which is why we have comprehensive reporting suites for both Open Web and Social. With plans for a combined, omnichannel reporting tool, separate reporting solutions allow you to pull more granular details according to the data availability of the platform you're reporting on.
- Creative optimization process: We believe marketers must develop their creative optimization process, so we've developed the tools and processes to make that adoption easier.
Operational dashboards and reporting
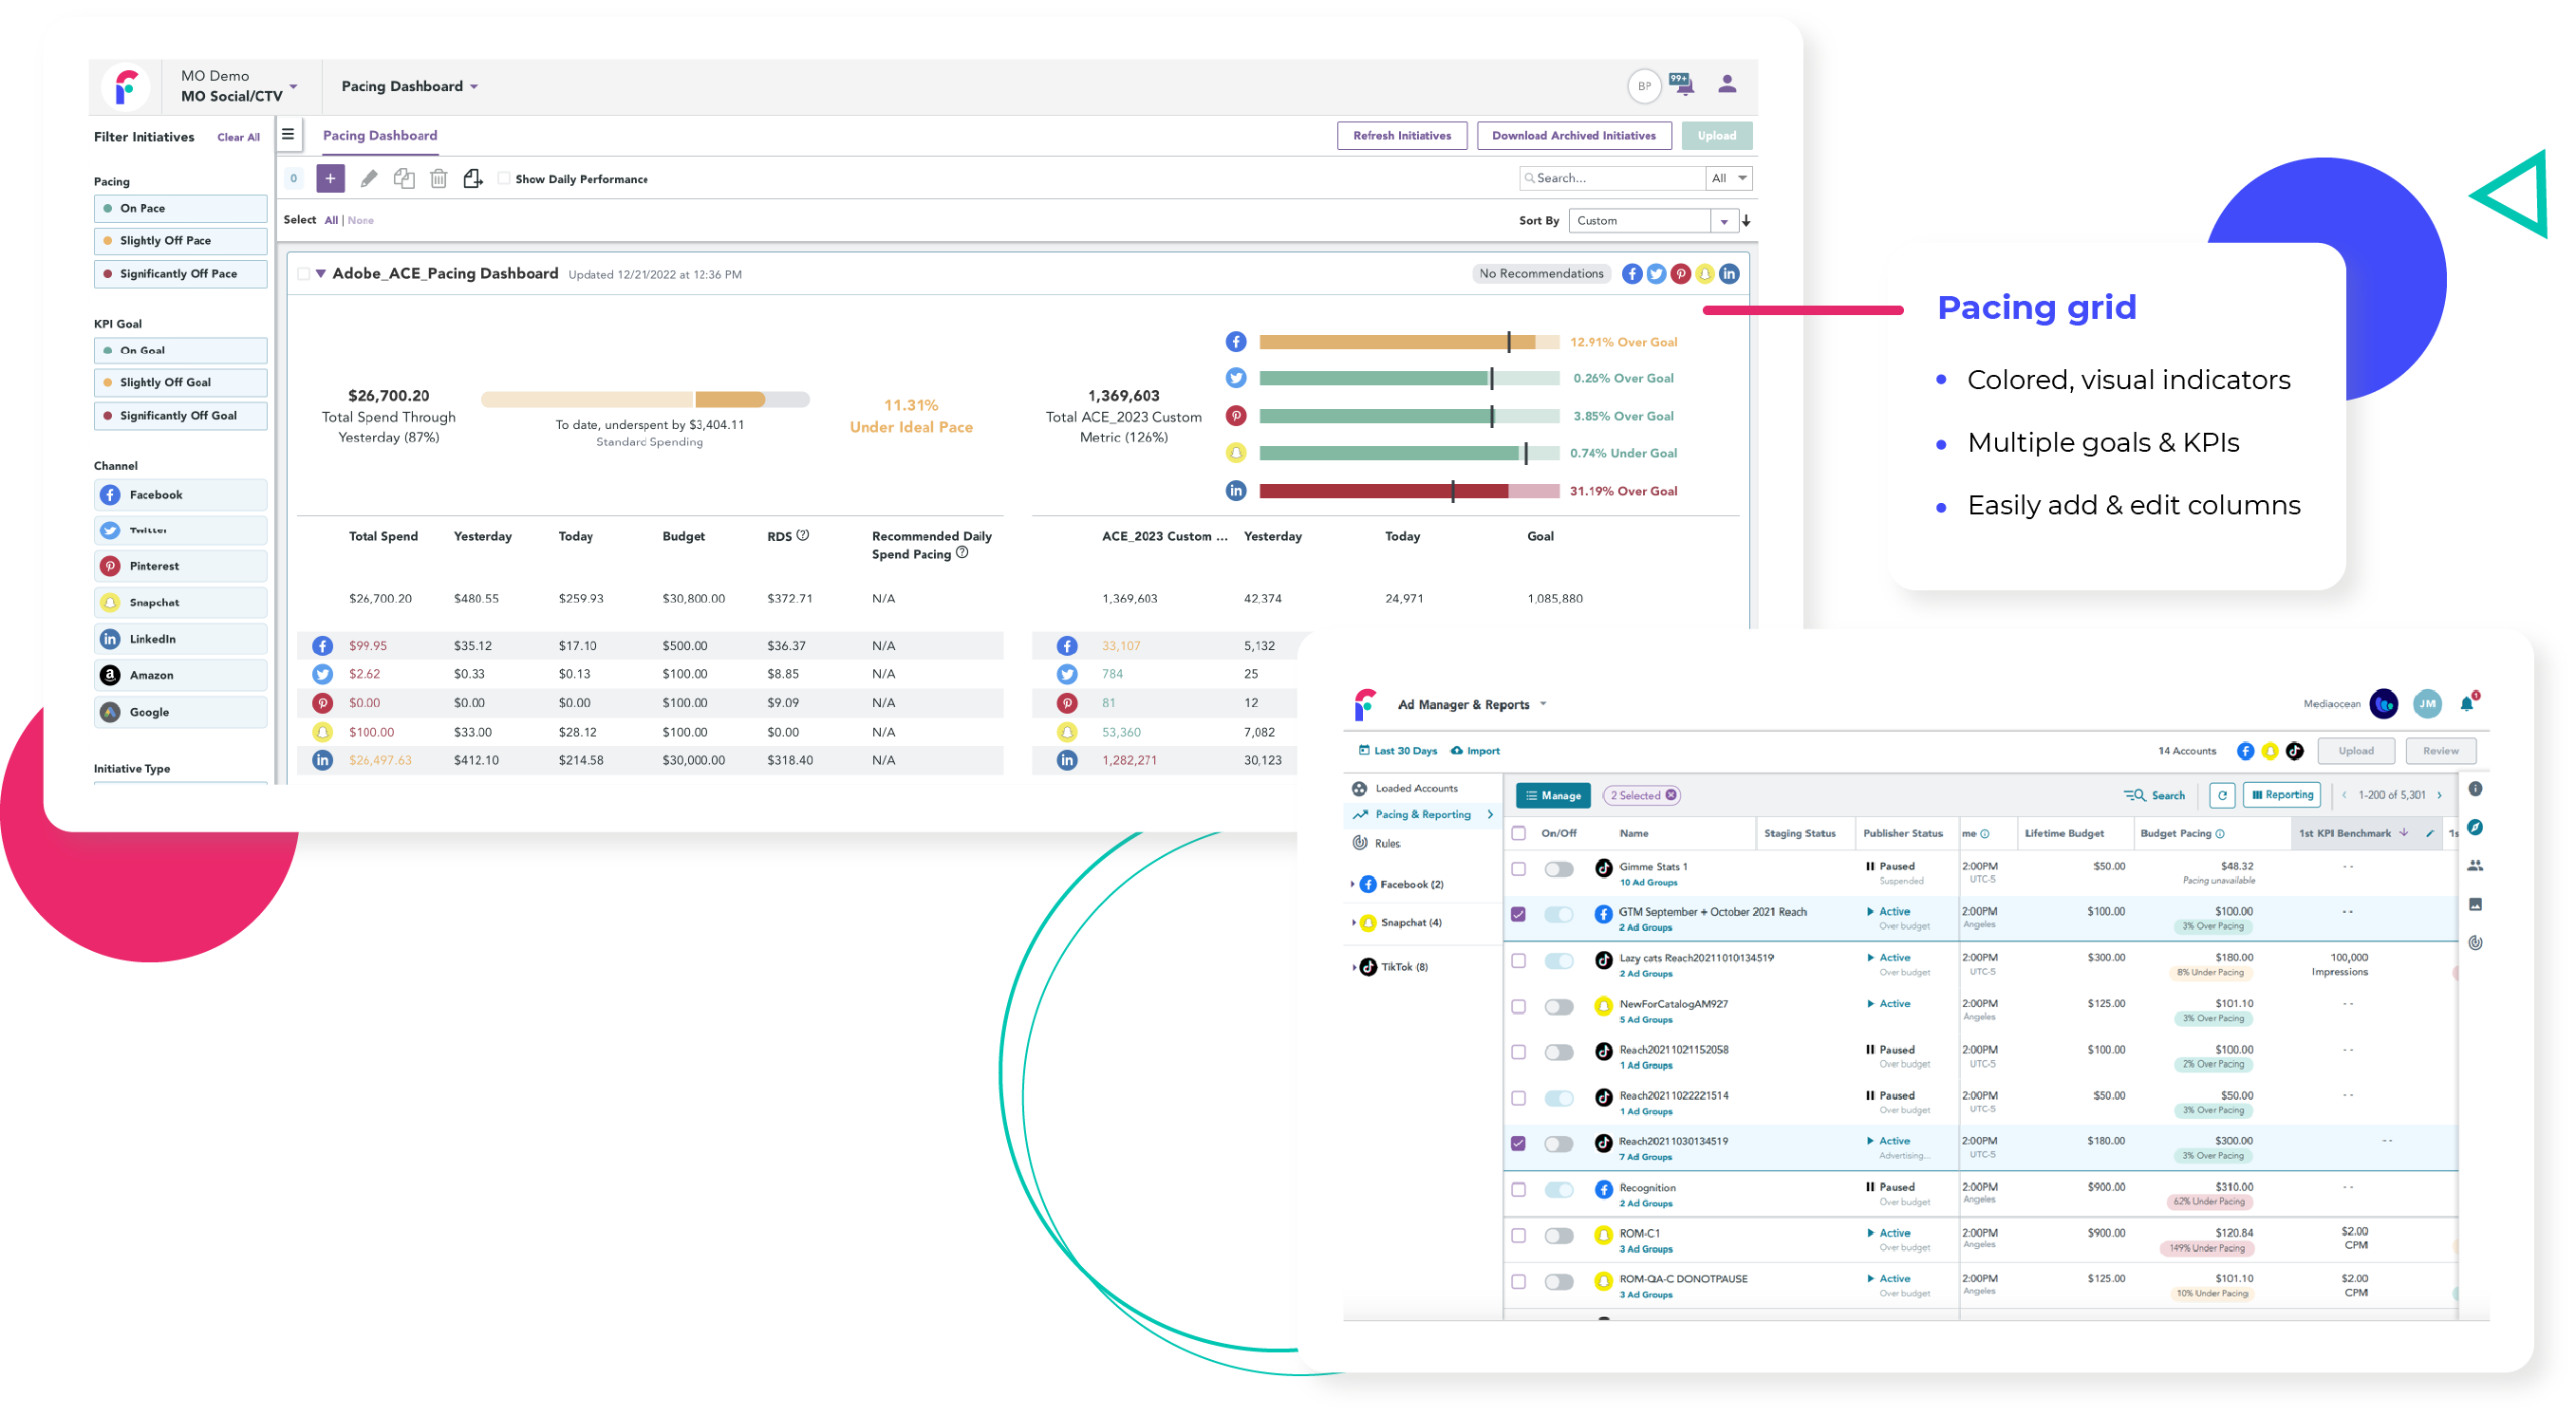
Cross-publisher dashboards provide an easy-to-use interface for monitoring pacing, visualizing KPI trends, setting up performance alerts, and quickly reallocating budgets across social publishers. This saves significant time in campaign management and performance tracking. Additionally, you can avoid overspending or underspending budgets with fluid campaign-level budgets and optimizations across ad sets. You can also set up pacing alerts and budget reallocation approvals and export a change log of historical recommendations.
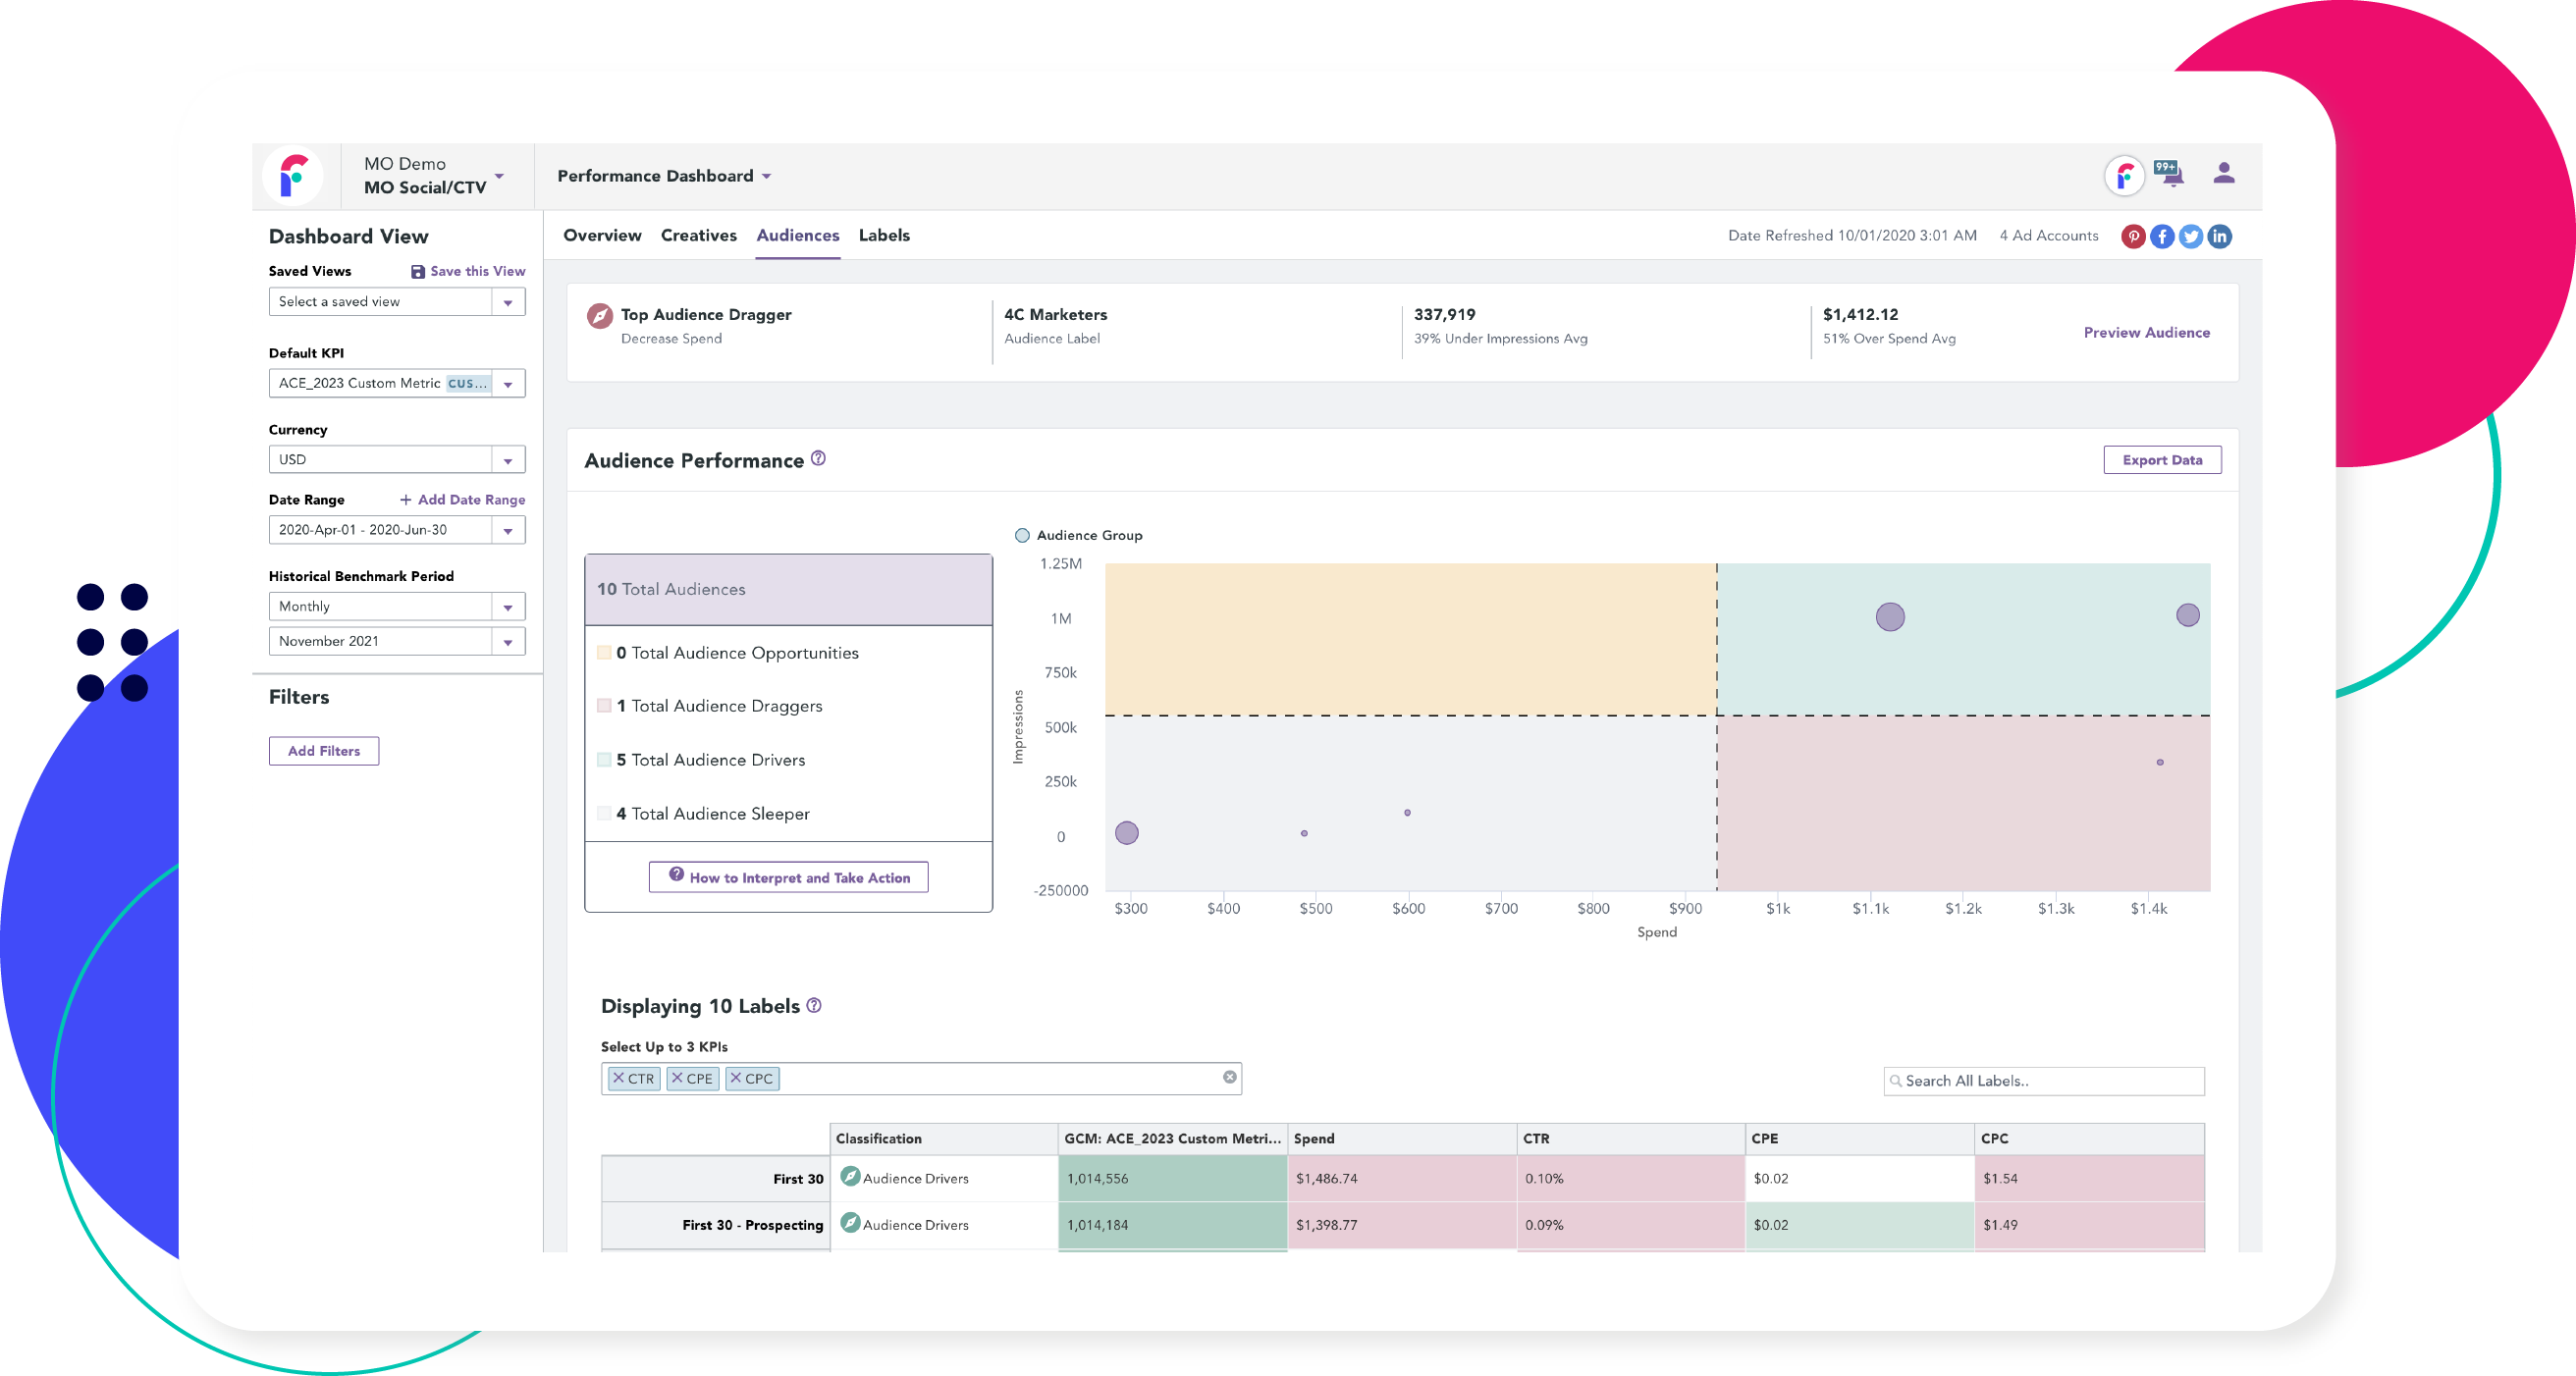
Performance dashboards allow you to understand better and respond to the connection between creative, audiences, and media. This is achieved by pulling budget data and creative and audience data to action on those learnings quickly, all within the platform. Additionally, the ability to customize time periods and KPIs provides teams with more granular insights and trends. Most importantly, performance can be viewed and shared across brand, creative, and media teams, facilitating collaboration and faster in-market impact through in-page optimization tools.
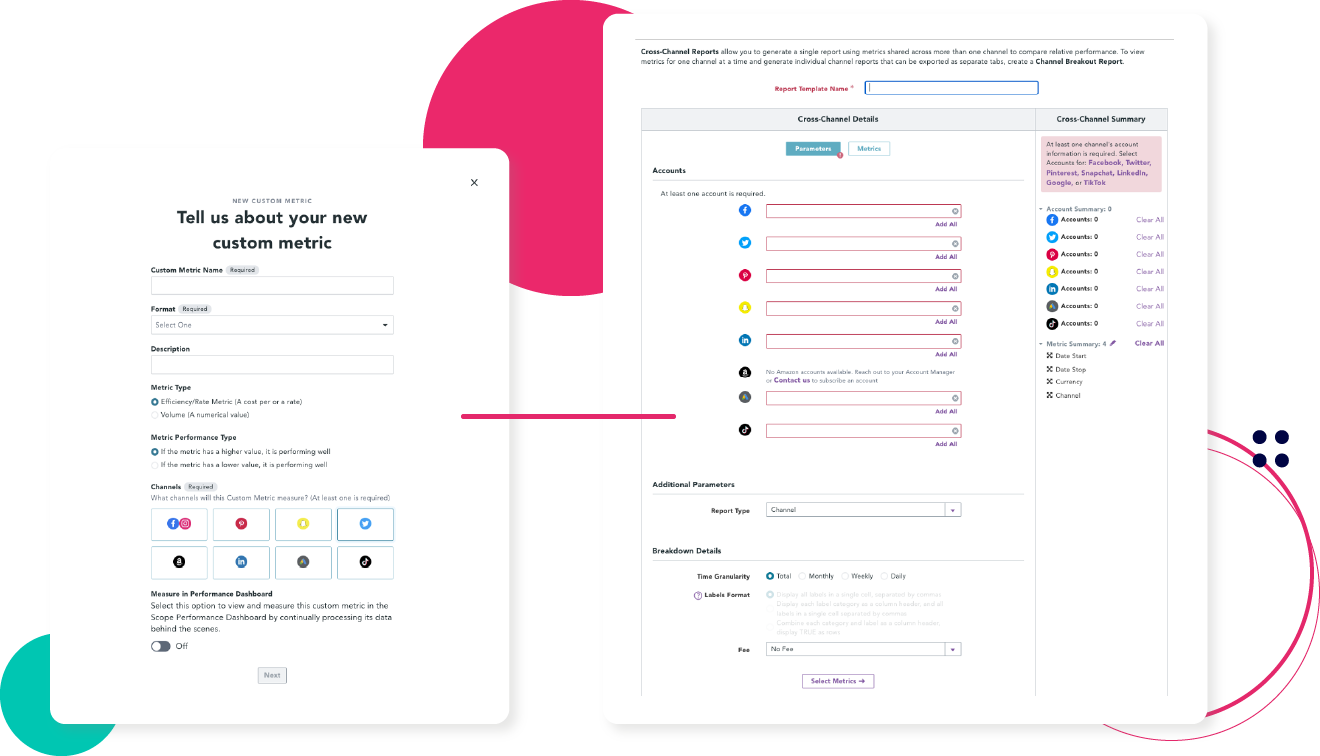
The holistic measurement module allows you to integrate and analyze source-of-truth measurements against your social or other digital campaigns from your preferred partner (e.g., Google Analytics, Moat, Kochava, Search Ads 360). You can ingest and match your various data sources into a single, compiled report and create custom KPIs for a more unified approach to measurement, insights, and optimizations across your social publishers. These reports can be pulled directly from our platform or scheduled and delivered across your organization via API, email, SFTP, or web query.
Report Hub provides one-click access to the necessary data at the required level of granularity to answer the current question. This includes delivery trends over time, KPI trends across partners, version-level performance, creative label details, geographic views, or any combination. Additionally, the Report Hub enables automated and scheduled reporting, making your data available at the frequency and in the format that best supports your existing processes and workflows.

In addition to Report Hub, we also offer several dashboards for a more straightforward, more visual answer to several common questions:

The Video dashboard displays essential delivery and performance metrics for your video investment. This dashboard is ideal for teams seeking to comprehend any differences in delivery and performance across devices, including desktop, mobile, and CTV. Additionally, it helps you understand your campaign's overall reach, delivery, and performance.
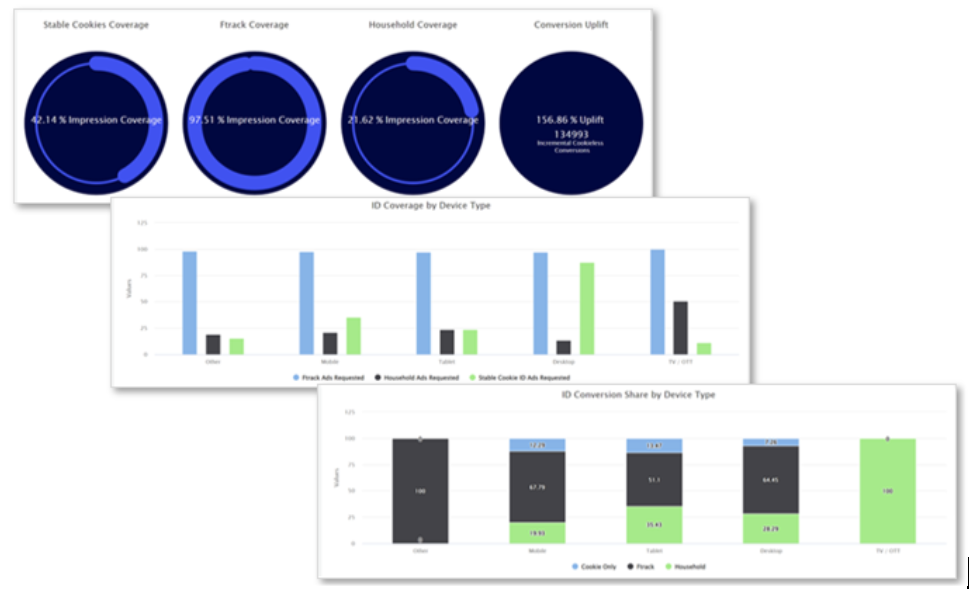
The Identity Health dashboard helps brands understand the value of incorporating cookie-less IDs into their measurement and attribution efforts. This dashboard quantifies how quickly cookies are being deprecated for your campaign and provides a direct comparison of the persistence, accuracy, and value of our user-level and household-level cookieless identity solutions.
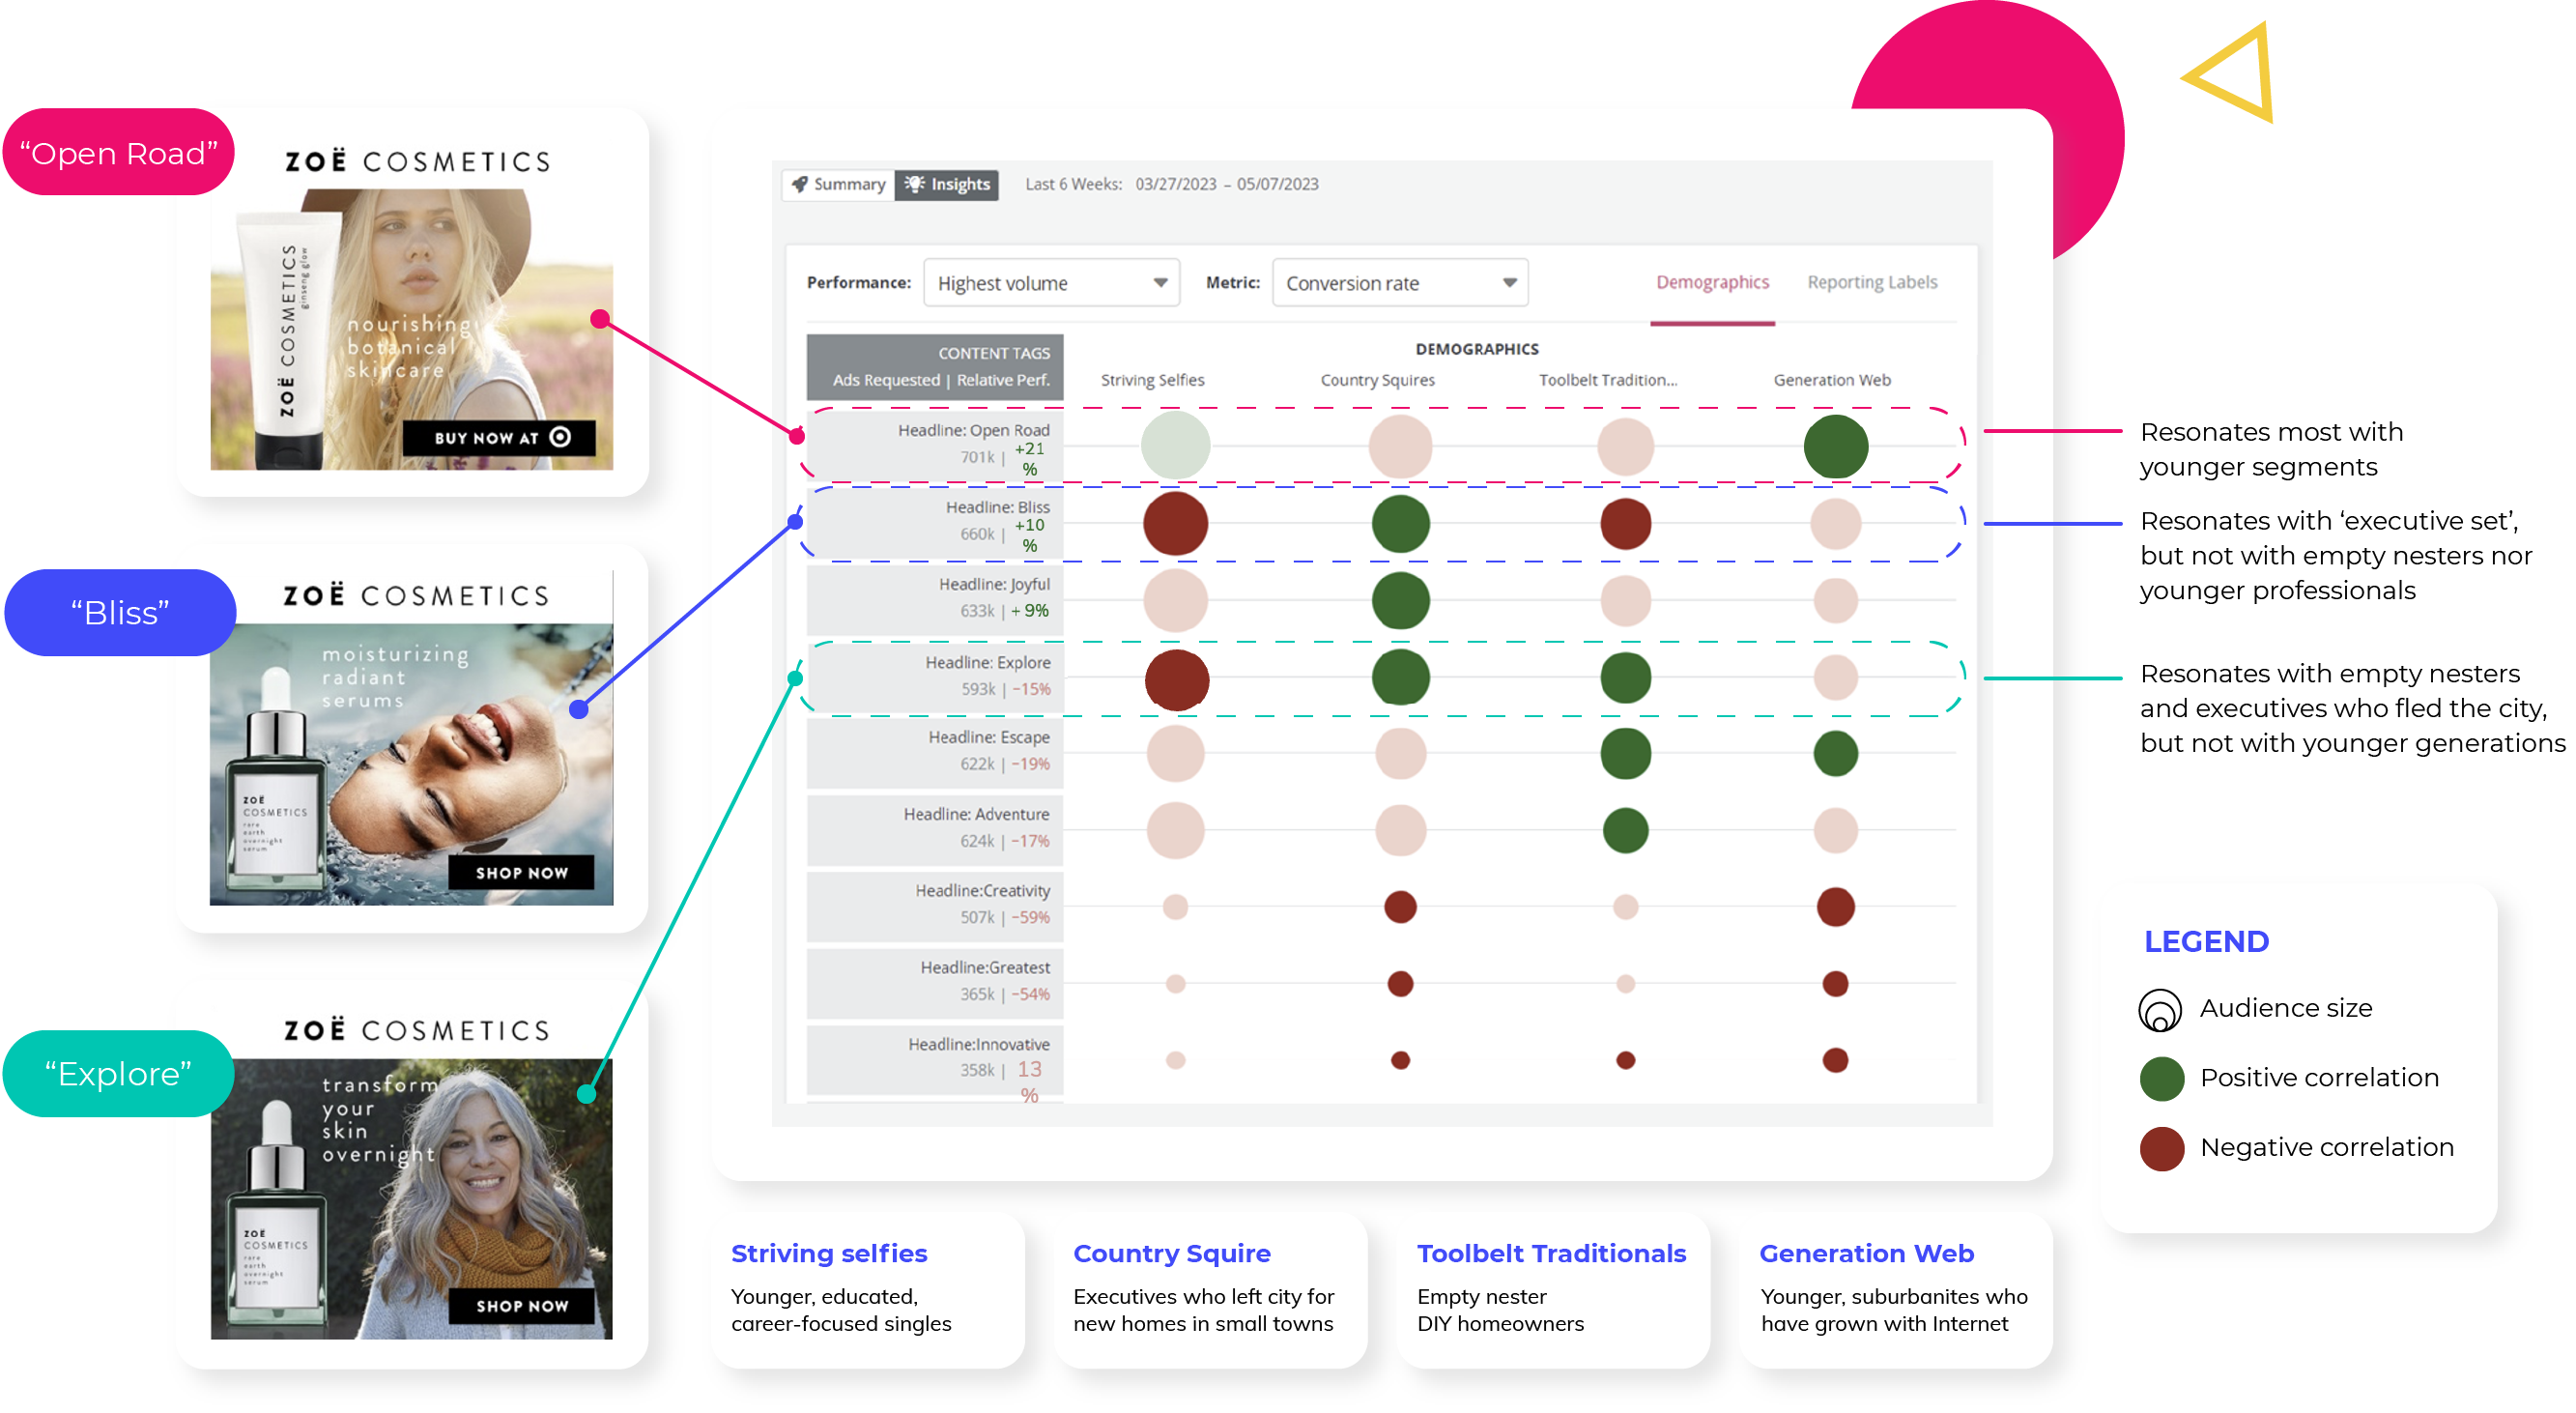
The Creative Insights dashboard demonstrates the connection between a message and its audience by visualizing how content performs differently across segments. Acting as a visual data grid, the size of the circles represents impression volume, whereas the color represents relative performance. As shown in the example, it becomes easy to see which concept, displayed on the left, resonates with which audience, displayed along the top. This view makes identifying opportunities for creative optimization seem effortless.

Ad Server Log Files: While our dashboards simplify and aggregate data, our log files are designed for brands with the resources to analyze data at a granular level. Our files are user-level, customizable, and transparent, giving you complete access to and ownership of your data. We also offer an enhanced version called Connected Logs, where we can facilitate user-level connections across disparate reports. As a result, brands have immediate access to model-ready data spanning ad servers, DSPs, verification, and data partners.
Creative optimization process
All the reporting views and dashboards we provide are designed to lead to creative insights and opportunities for learning. However, these insights are not valuable unless they are acted upon. Flashtalking has extensive experience helping clients implement creative optimization processes. Although every organization is unique, some consistent best practices are enabled by our tech stack:
- Developing omnichannel creative concepts that allow you to leverage a single creative asset library
- Using our creative automation tools to create versions for all of your desired audiences
- Applying creative labels, which is a critical step required to unlock creative intelligence and insights
- Activating that creative across all channels, including social media, the open web, and CTV
- Analyzing the data as it is received and using our reports and dashboards to discover deeper insights
From there, you can iterate by taking informed, repeated action. This could involve shifting impressions to higher-performing ads, retiring an underperforming concept, introducing a bold new design, adjusting your videos or imagery, trying a new CTA, or expanding the use of a successful one. The opportunities are endless, but the data helps you focus and prioritize.

Market agility
The Flashtalking tech stack offers several benefits for marketers, including production efficiencies, revenue enhancement, and media cost efficiencies (we will share our ROI calculators in subsequent posts). However, the benefit we are most proud of is market agility - the speed with which you can respond to the market. The central building block for this is automation, which connects silos across teams, processes, and technology platforms.
We are excited to discuss how our end-to-end automated workflow and consistent set of tools can help you achieve robust creative optimization. By doing so, you can become more effective, efficient, and agile in your marketing efforts!
Learn more
This concludes our blog series on the Flashtalking Framework. Please get in touch with us if you want to learn more about our operational reports and dashboards or any other aspect of our ad tech stack.


